

SigNoz is an open source observability platform built on OpenTelemetry that brings logs, metrics, and traces together in one application. OptiTech's OpenTelemetry integration sends your project's metrics and Postgres logs to SigNoz, so you can monitor your database alongside the rest of your stack.
This guide walks you through setting up the integration. You'll learn how to:
- Find the ingestion key and OTLP endpoint for your SigNoz Cloud account.
- Set up the OpenTelemetry integration in your OptiTech project.
- Verify that your OptiTech metrics and logs are flowing into SigNoz.
- Build a dashboard in SigNoz to visualize your OptiTech metrics.
By the end, you'll have OptiTech metrics and logs flowing into a SigNoz dashboard.
Prerequisites
Before you begin, ensure you have the following:
- OptiTech account and project: If you don't have one, sign up at OptiTech. Your OptiTech project must be on the Scale or Business plan to use the OpenTelemetry integration.
- SigNoz account: A SigNoz Cloud account. A free trial is sufficient to start. This guide uses SigNoz Cloud; if you run a self-hosted SigNoz instance, the steps are the same except that you point OptiTech at your own collector endpoint.
Get your SigNoz ingestion key and endpoint
You need credentials that authorize OptiTech to send OpenTelemetry data to your SigNoz Cloud instance.
-
Log in to your SigNoz Cloud account.
-
Navigate to Settings > Ingestion Settings.
-
Copy your Ingestion Key. OptiTech sends this value with every request to authenticate your data.
-
Note your region. SigNoz Cloud is available in multiple regions, and your OTLP endpoint depends on it:
Region Endpoint US https://ingest.us.signoz.cloudEU https://ingest.eu.signoz.cloudIndia https://ingest.in.signoz.cloudYour region and endpoint are shown on the Ingestion Settings page. For more details, see the SigNoz ingestion overview.
Keep the Ingestion Key and the OTLP endpoint URL for your region handy. You will need them in the next step to configure OptiTech.
-
Configure the OptiTech OpenTelemetry integration
Use the credentials from SigNoz to configure the integration in your OptiTech project.
-
Navigate to the OptiTech Console and select your project.
-
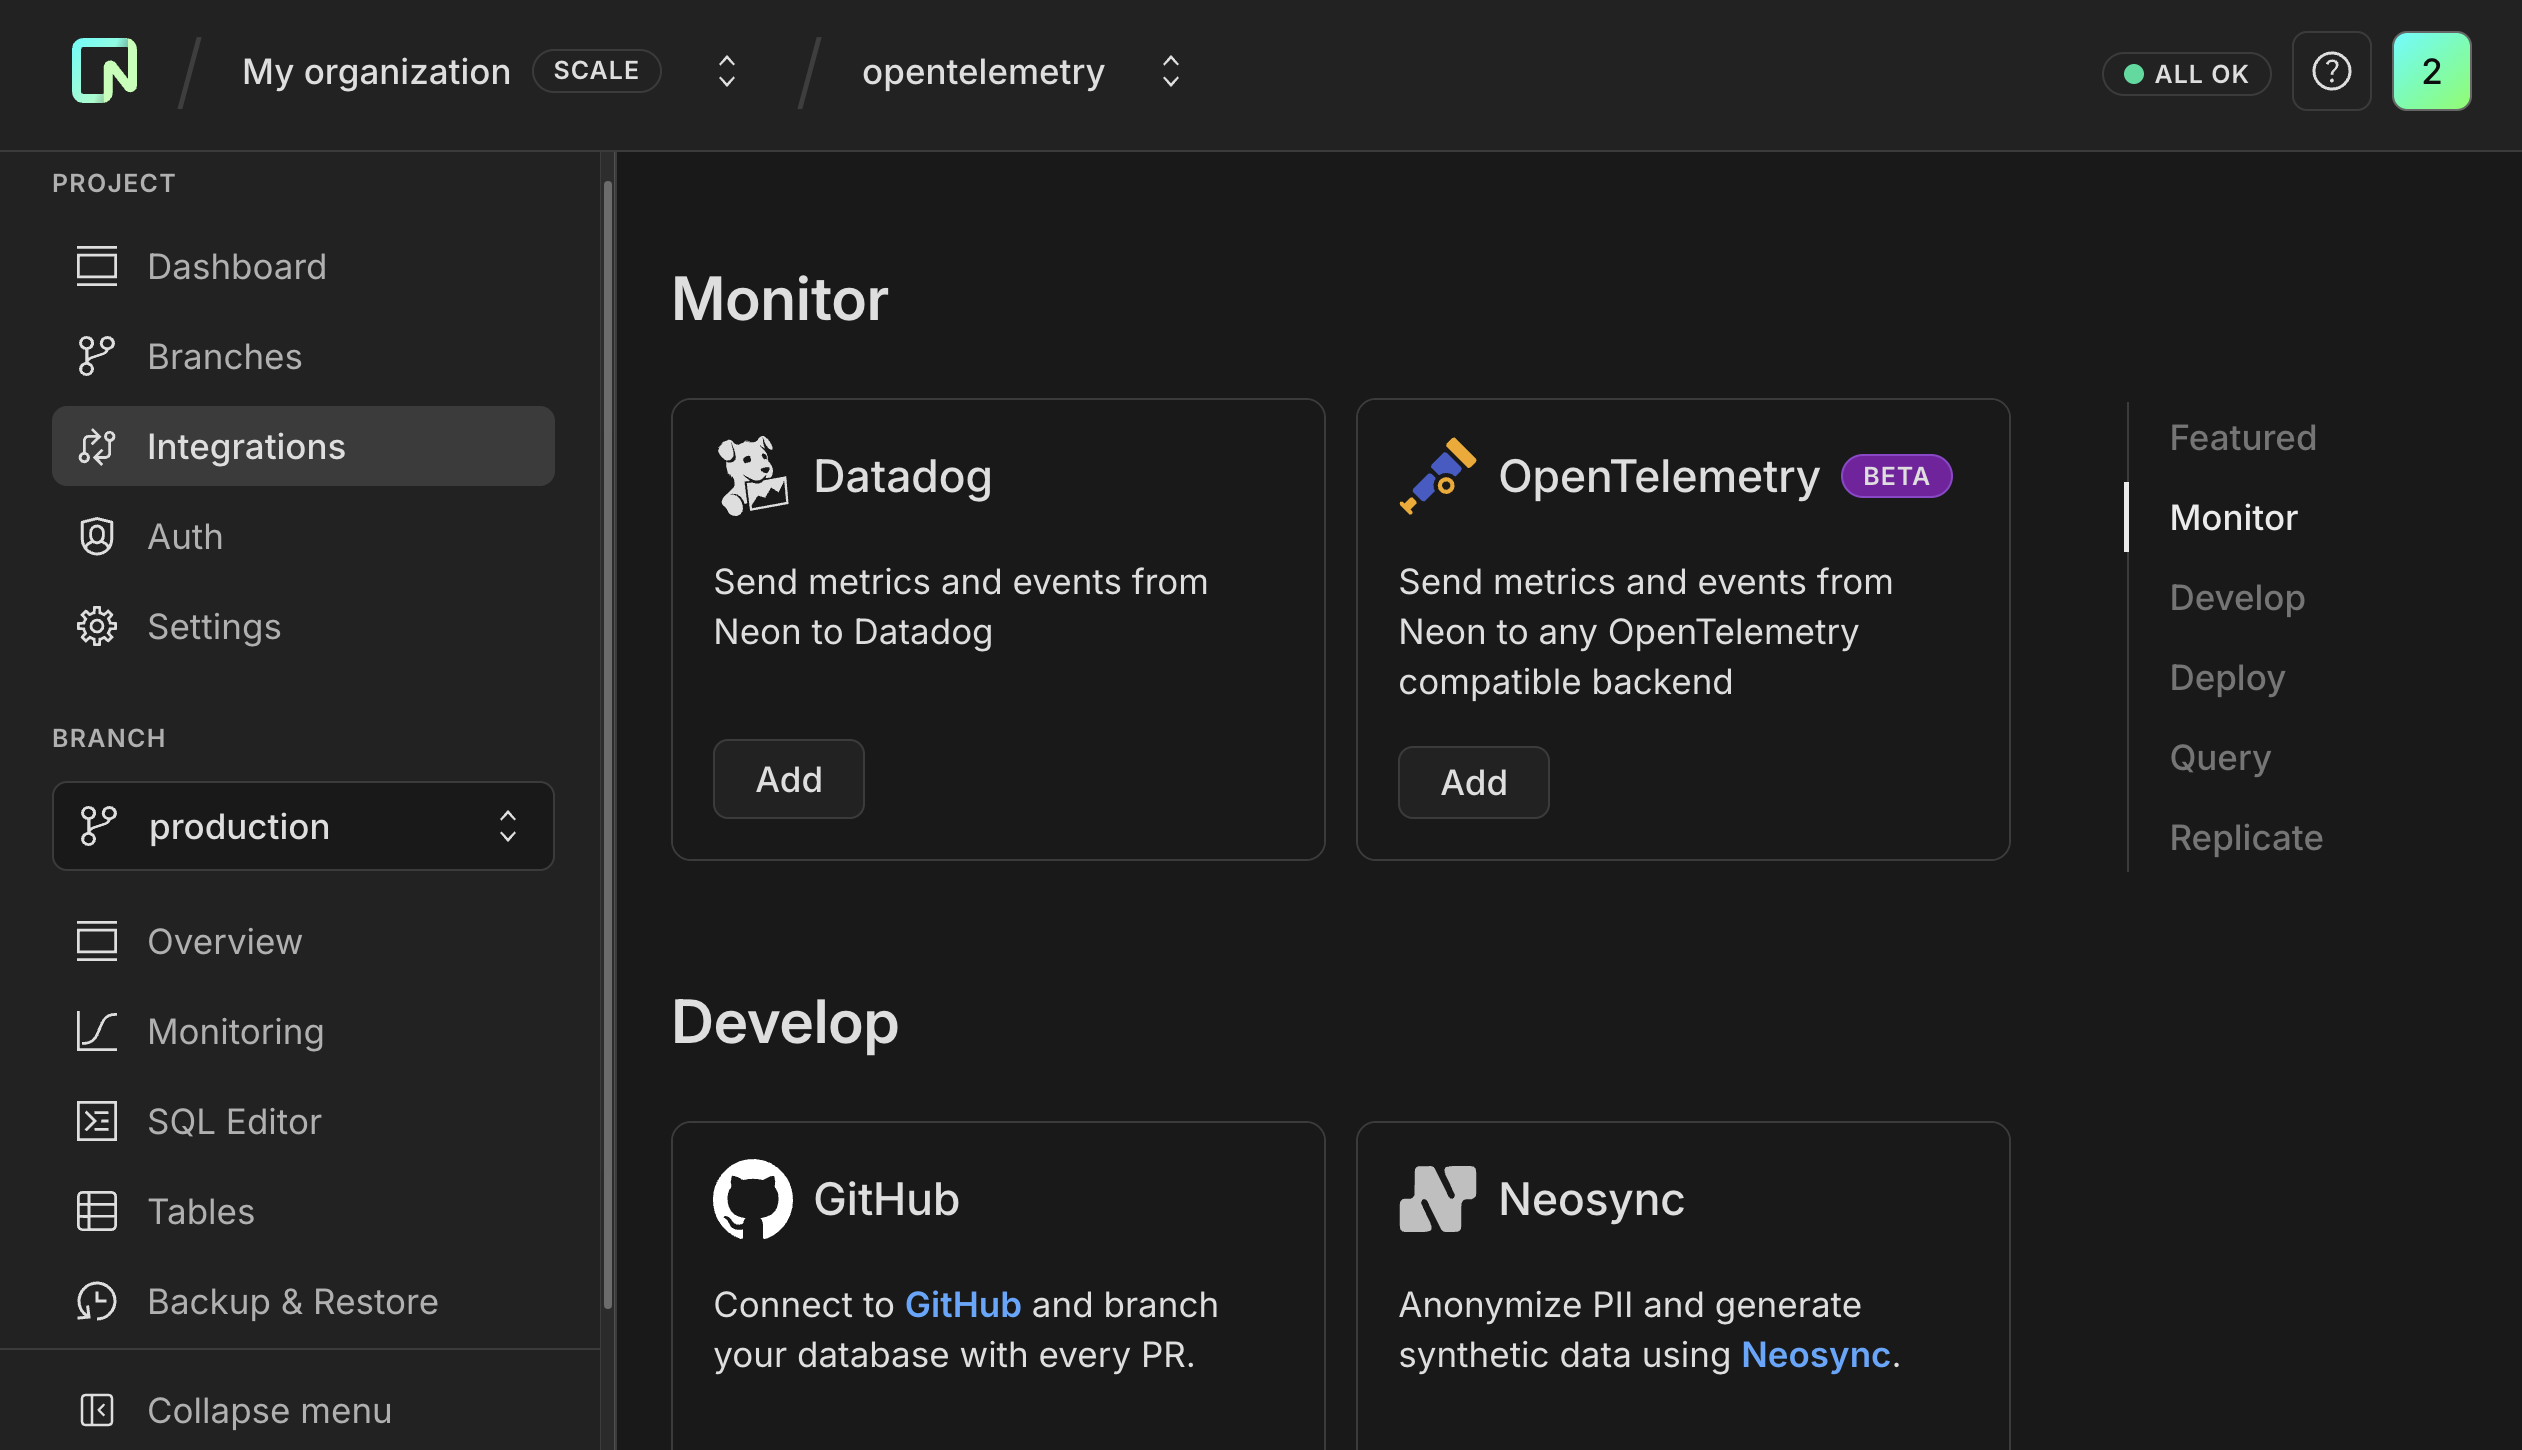
From the sidebar, go to the Integrations page.
-
Find the OpenTelemetry card and click Add.
-
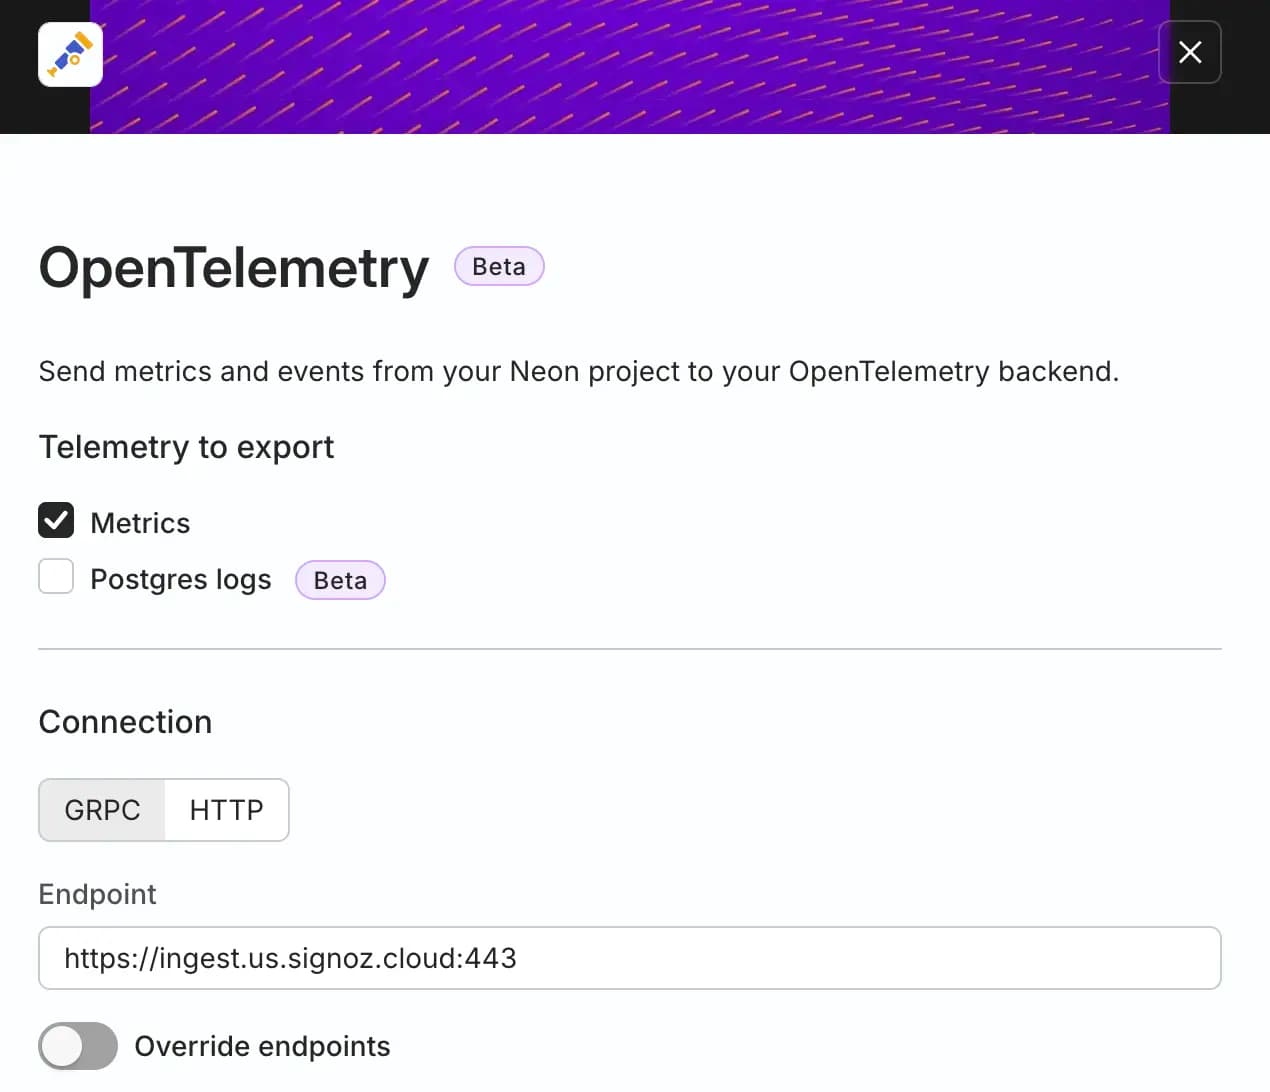
A sidebar form opens. Choose the telemetry you want to export. Check both Metrics and Postgres logs to send all available data.
-
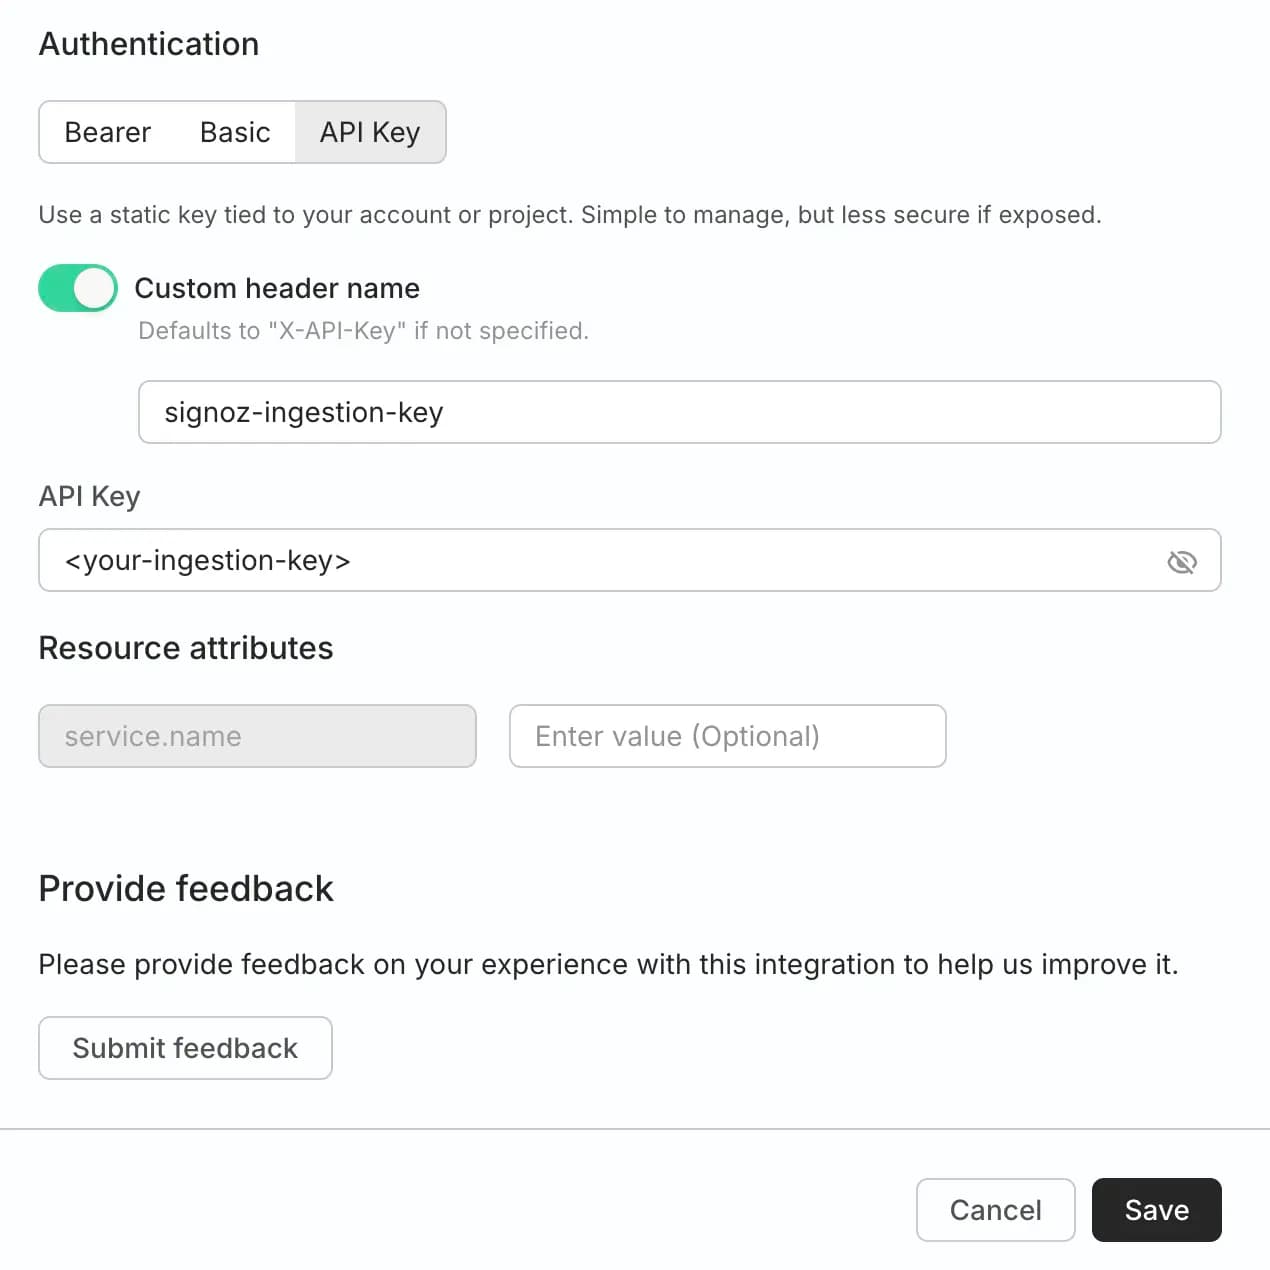
Next, fill in the destination details using the credentials you gathered from SigNoz:
- Connection: Select HTTP.
- Endpoint: Paste the OTLP endpoint URL for your SigNoz region, for example
https://ingest.us.signoz.cloud.important
Enter only the base endpoint URL. OptiTech automatically appends the signal-specific paths (
/v1/metricsand/v1/logs), so do not add them yourself or you will get404errors. - Authentication: Select API Key.
- Header name: Enter
signoz-ingestion-key. - API Key: Paste the Ingestion Key you copied from SigNoz.
- Resource attributes: Add a
service.nameattribute to identify your data source in SigNoz. For example, set the key toservice.nameand the value tooptitech. - Click Save.
Data scope
The OptiTech OpenTelemetry integration sends data for all computes in your OptiTech project. For example, if you have multiple branches, each with an attached compute, metrics and logs will be collected and sent for each one.
-
Once saved, the OpenTelemetry integration appears as active on your project's Integrations page.
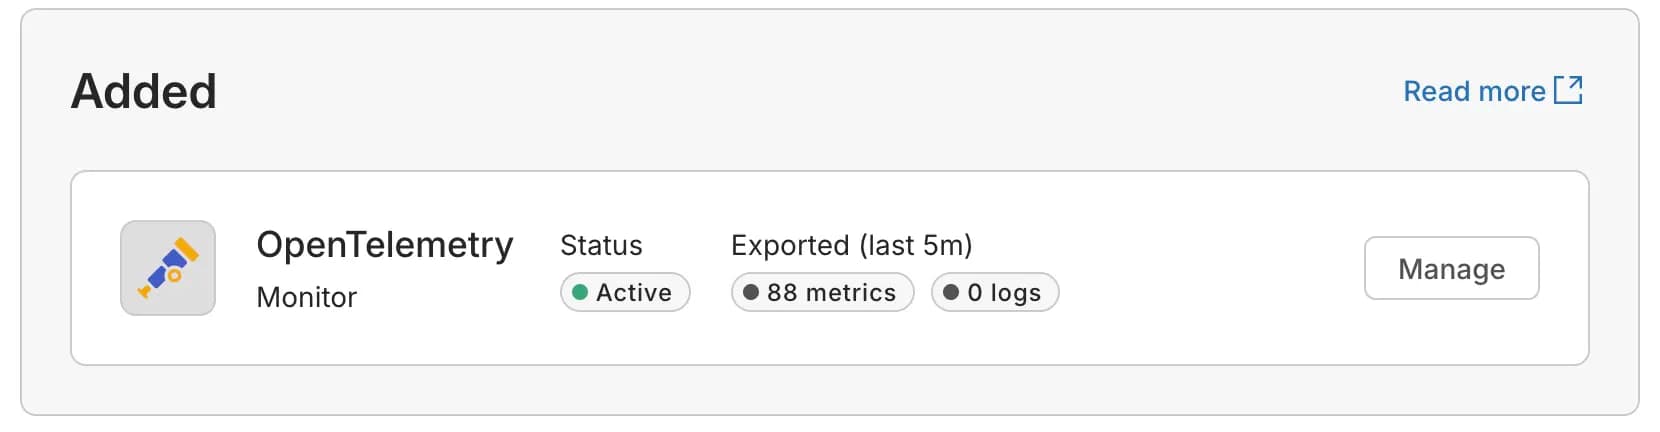
The integration is now active and will begin sending data from your OptiTech project's computes to SigNoz.
-
Verify the data flow in SigNoz
To confirm that your integration is working, check that both logs and metrics are arriving in SigNoz.
-
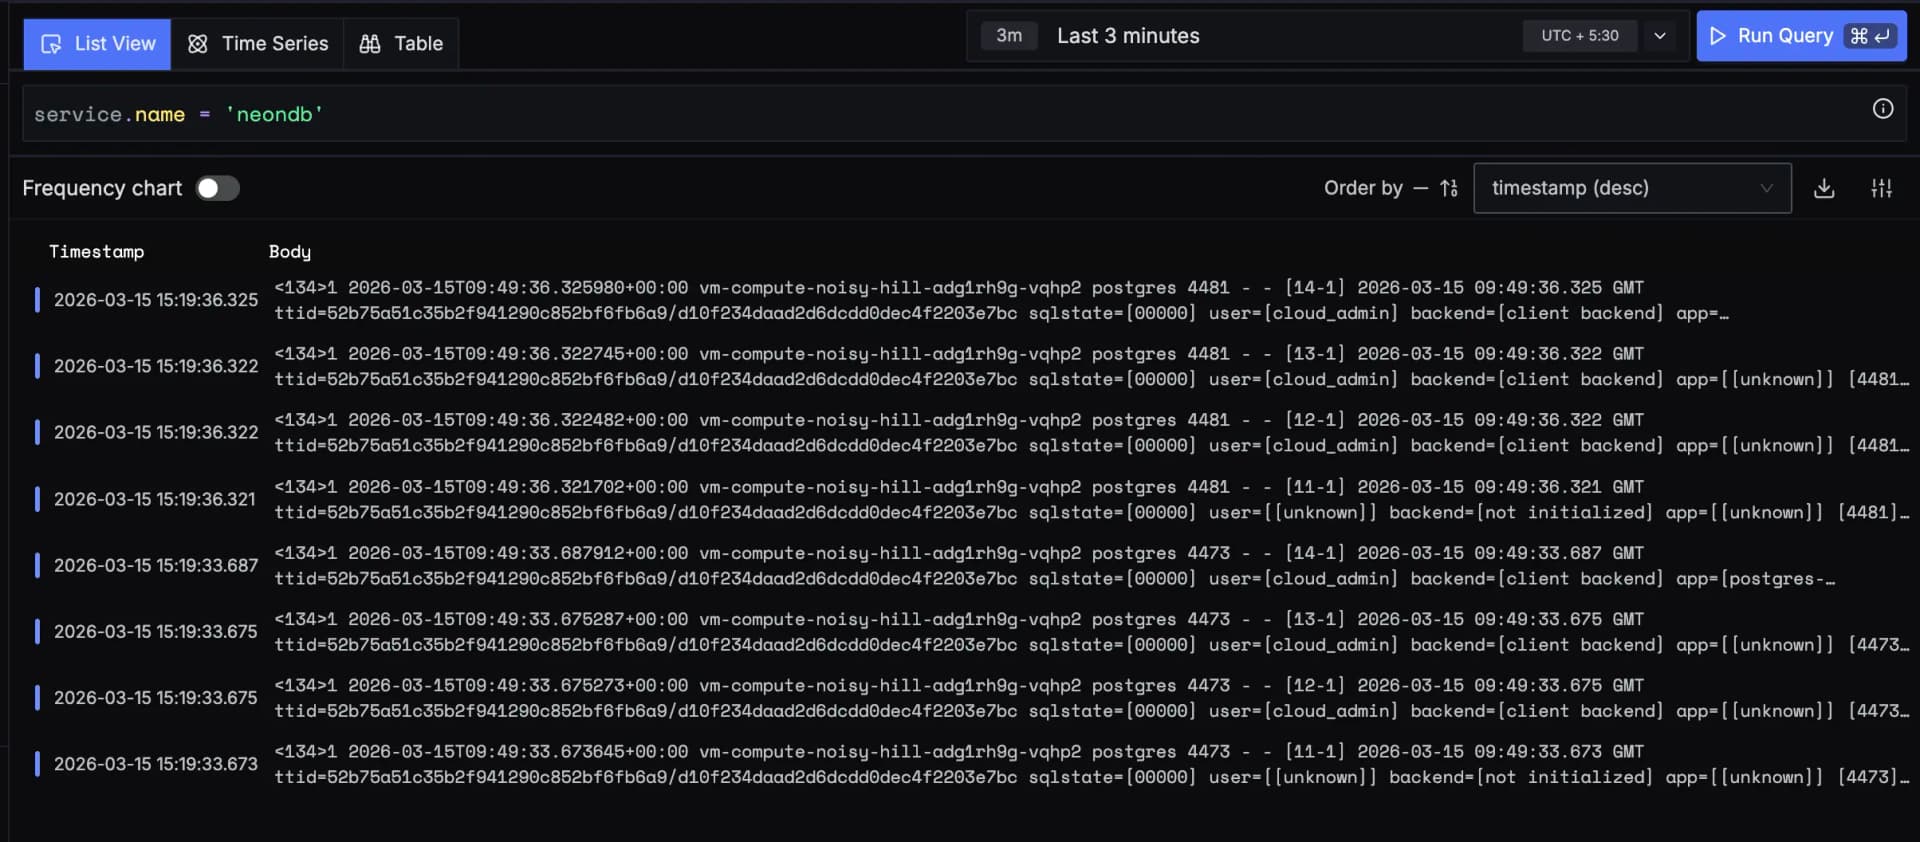
Go to your SigNoz instance and open the Logs > Logs Explorer.
-
Filter by the resource attribute you set earlier, for example
service.name = optitech.You should see Postgres logs from your OptiTech compute streaming into SigNoz. This confirms that the integration is working correctly.
note
It may take a few minutes for the first logs and metrics to appear after you enable the integration.
-
To confirm metrics are arriving, open Metrics > Metrics Explorer and search for metrics prefixed with
optitech_, such asoptitech_connection_counts.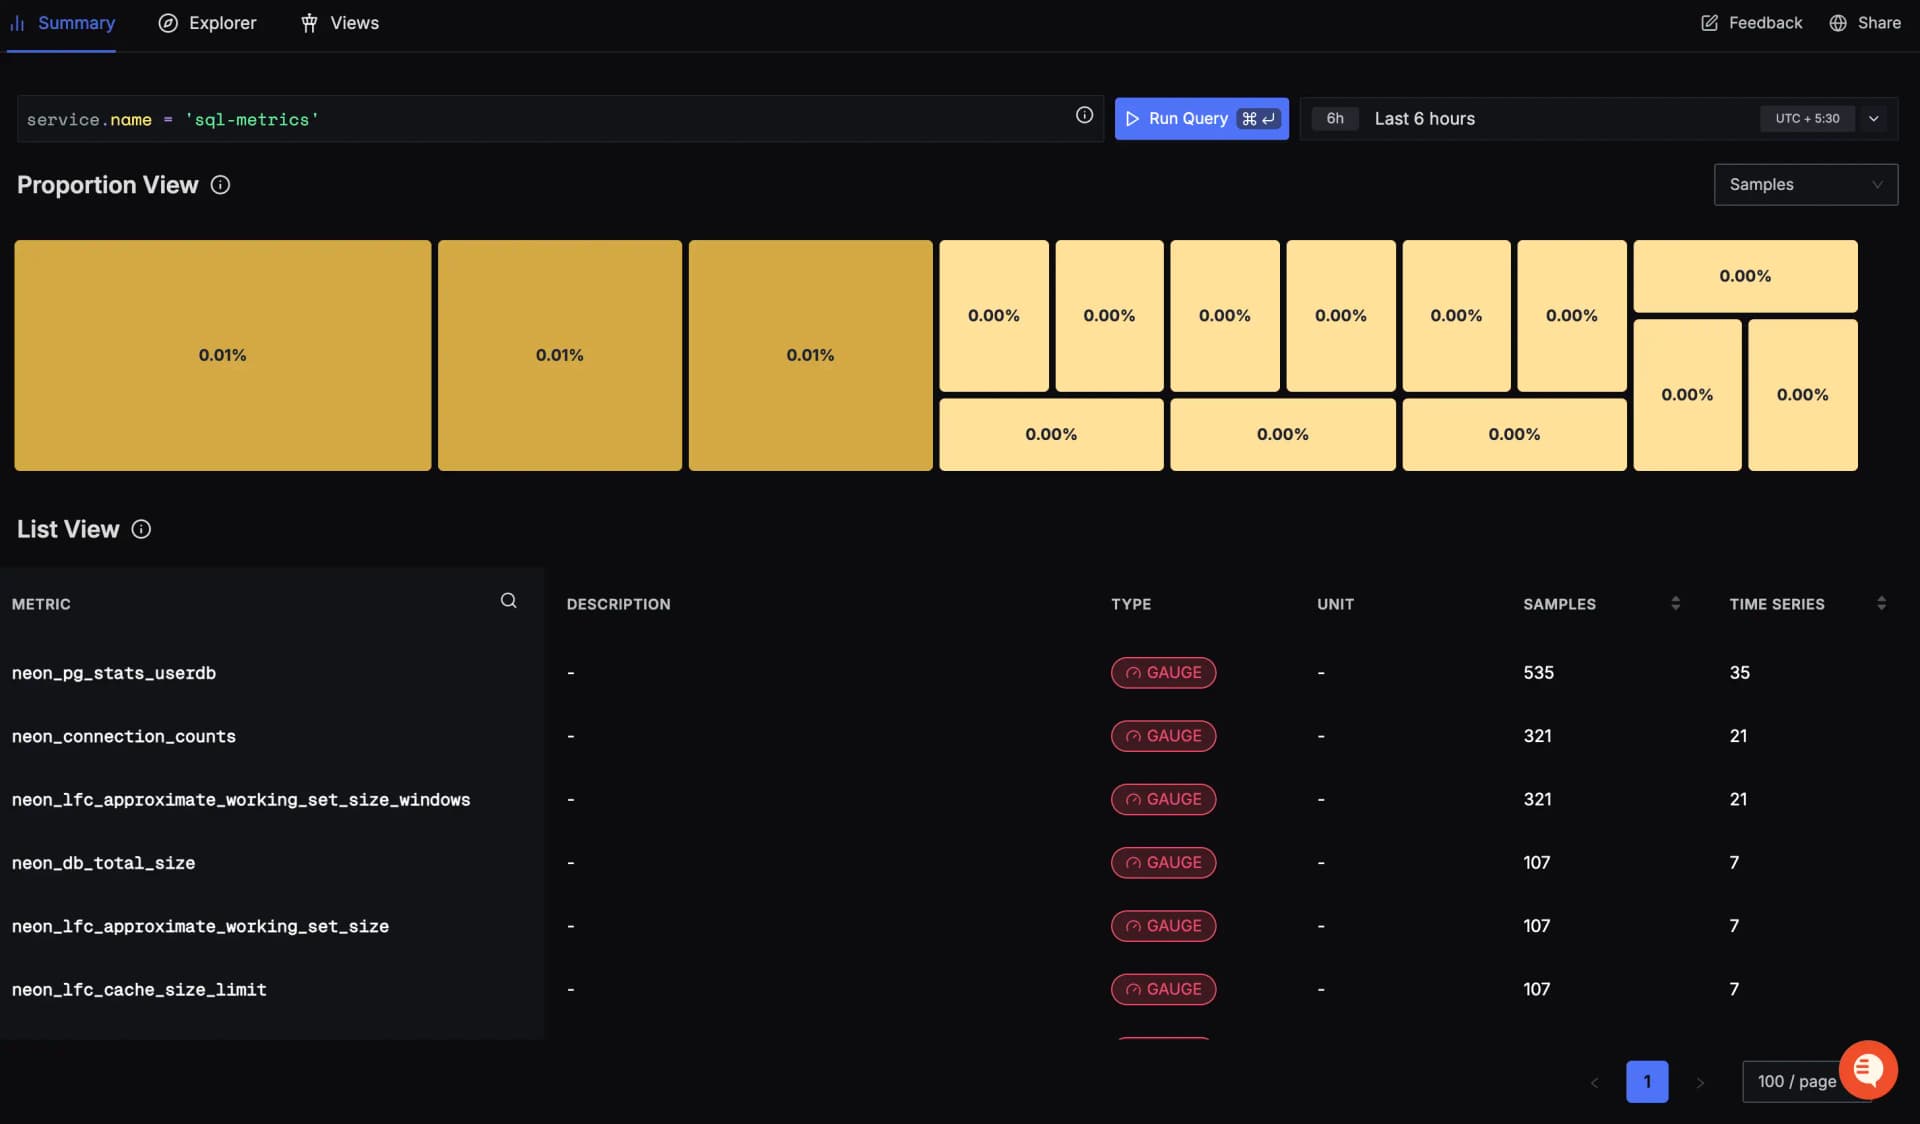
Compute activity
OptiTech computes only send logs and metrics when they are active. If you have the Scale to Zero feature enabled and a compute is suspended due to inactivity, no telemetry data will be sent. If you notice gaps in your data, check your compute's status on the Branches page in the OptiTech console.
-
Visualize OptiTech metrics with dashboards
The Metrics Explorer works for ad-hoc queries. To track trends over time and see an overview of your database's health, build a SigNoz dashboard.
Create a custom OptiTech dashboard
- From the left navigation menu in SigNoz, select Dashboards.
- Click New Dashboard > Create dashboard.
- Give your dashboard a descriptive name, such as
OptiTech Project Metrics.
Create your first panel
- On your new dashboard, click New Panel and choose the Time Series panel type.
- In the Query Builder, set the metric to
optitech_connection_countsto visualize the number of active and idle connections to your database over time. - Adjust the aggregation and grouping as needed, then save the panel to your dashboard.
Explore available OptiTech metrics
OptiTech exports a range of metrics for your dashboards, including OptiTech-specific metrics and compute host metrics. For example:
optitech_connection_counts: Monitor the number of active and idle database connections.optitech_db_total_size: Track the total size of all databases in your project, in bytes.host_cpu_seconds_total: Track the CPU seconds accumulated in different operating modes (user, system, idle, etc.).host_memory_active_bytes: Monitor active memory usage on the compute.
For a comprehensive list of all metrics you can use in your dashboards, see the OptiTech Metrics and Logs Reference.
With OptiTech's database metrics and logs flowing into SigNoz alongside your application telemetry, you can correlate database behavior with the rest of your stack. For instance, you can line up a spike in optitech_connection_counts against error logs from a specific service to quickly identify which application is putting pressure on your database.
Summary
You've configured OptiTech to send metrics and Postgres logs to SigNoz using the OpenTelemetry integration. Your database's metrics and logs now arrive in SigNoz alongside the rest of your application telemetry.
From here, you can build dashboards, set up alerts, and correlate database behavior with the rest of your stack.
Resources
- OptiTech OpenTelemetry Integration
- OptiTech Metrics and logs reference
- SigNoz OptiTech Postgres integration guide
- SigNoz Cloud ingestion overview
- OpenTelemetry Protocol (OTLP) Specification
Need help?
Join our Discord Server to ask questions or see what others are doing with OptiTech. For paid plan support options, see Support.
