

You can monitor query history for your OptiTech project from the Monitoring page in the OptiTech Console.
- In the OptiTech Console, select a project.
- Go to Monitoring.
- Select the Query performance tab.
The Query performance view shows the top 100 previously run queries for the selected Branch, Compute, and Database. Queries are grouped by their normalized form, with identical queries shown as a single row with a Frequency column indicating the number of times that query has been executed. Queries can be sorted by Frequency or Average time. Use the Refresh button to load the latest queries.
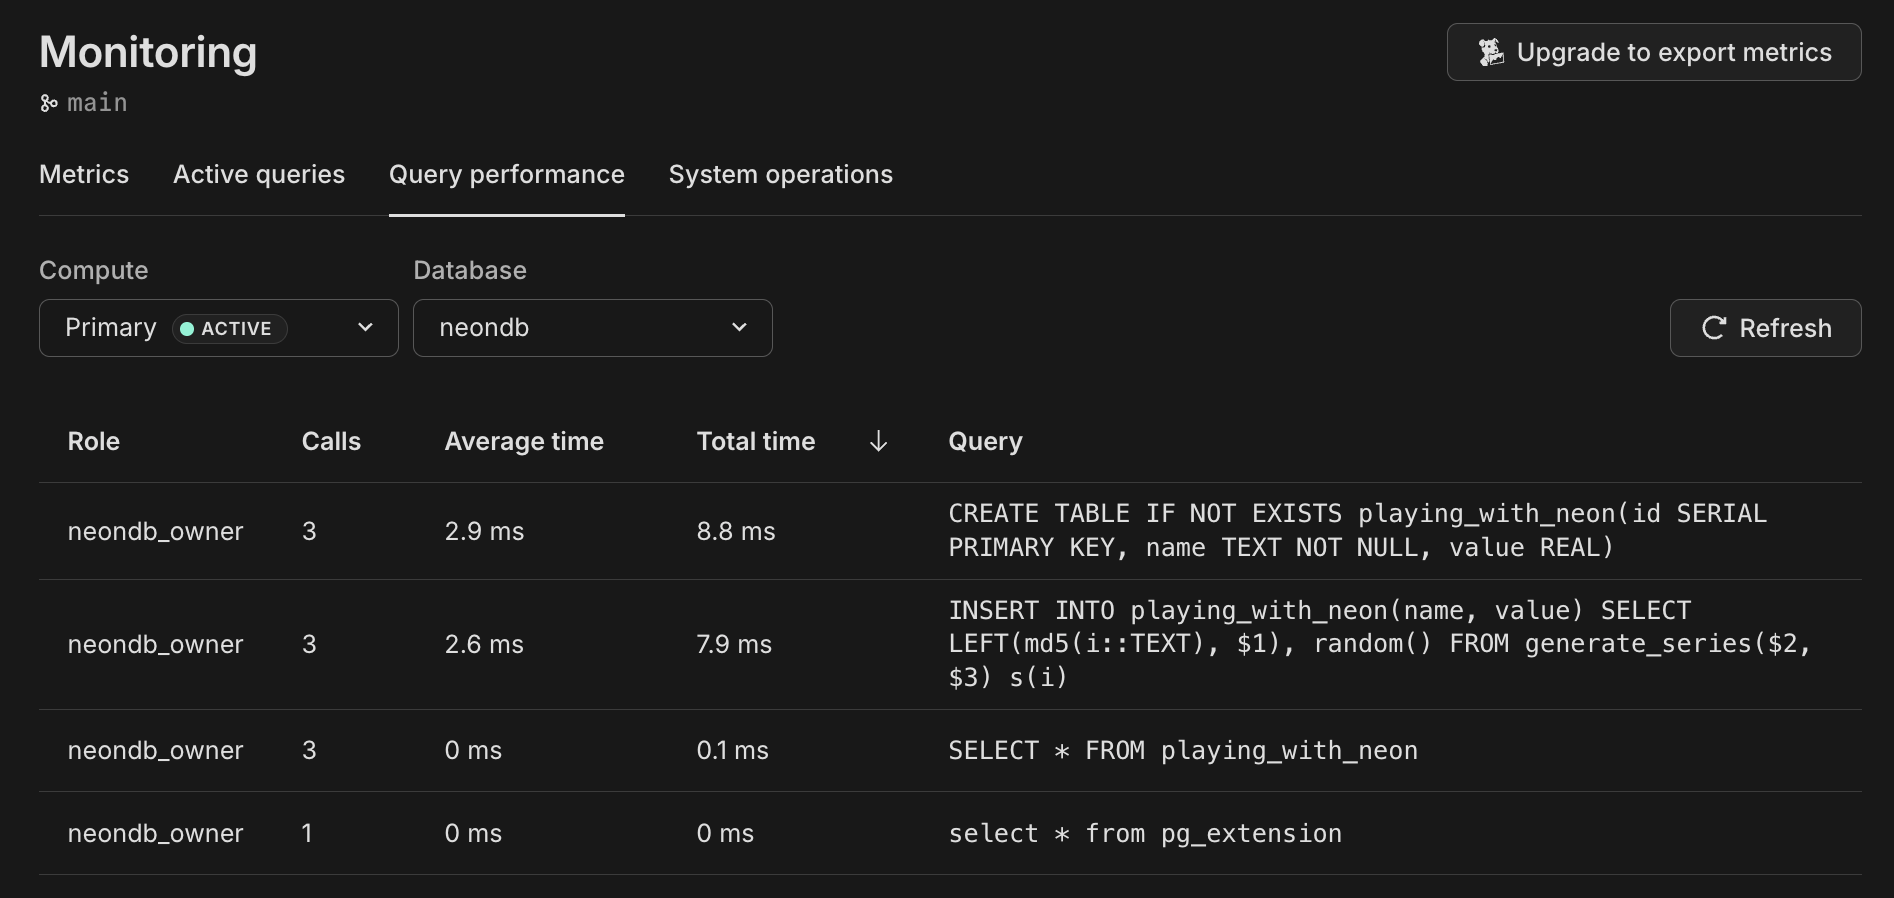
The Query performance view is powered by the pg_stat_statements Postgres extension, installed on a system managed database in your Postgres instance. Query history includes all queries run against your database, regardless of where they were issued from (OptiTech SQL Editor, external clients, or applications).
Query history when compute restarts
In OptiTech, data collected by the pg_stat_statements extension is not retained when your OptiTech compute (where Postgres runs) is suspended or restarted. For example, if your compute scales down to zero due to inactivity, your query history is lost. New data will be gathered once your compute restarts.
Running your own queries
To run your own queries on pg_stat_statements data, you can install the pg_stat_statements extension to your database and run your queries from the OptiTech SQL Editor or any SQL client, such as psql. For details on pg_stat_statements, including how to install it, what data it collects, and queries you can run, refer to our pg_stat_statements extension guide.